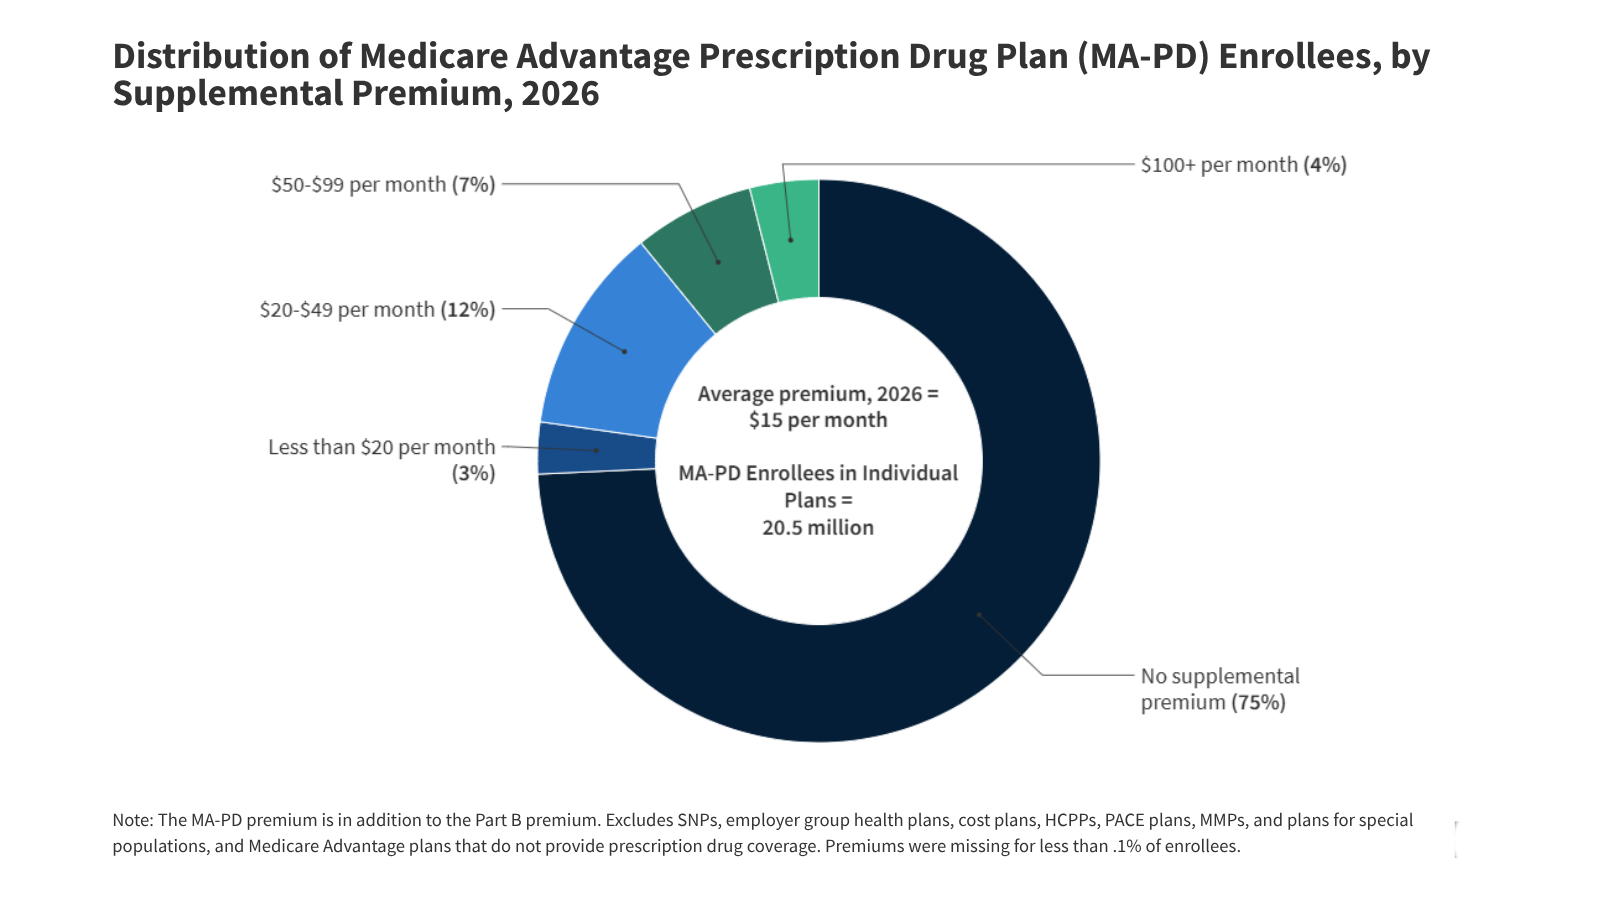
What happened: KFF Health News reports that by 2026, roughly three‑quarters of people in individual Medicare Advantage plans with drug coverage will pay no additional premium beyond their standard Part B amount. Across all enrollees, the average supplemental premium lands around $15 a month. HMOs command 61% of enrollment with premiums near $12, while local PPOs account for 38% at about $18. Out‑of‑pocket maximums average $5,421 for in‑network care and $9,825 when out‑of‑network services are included. PPOs show higher caps at $6,592; HMOs, about $4,636. Plans can sustain these benefits because they receive an average $2,664 per enrollee rebate above the estimated cost of Medicare‑covered services, more than double 2018’s level, according to MedPAC. Cost management tools remain everywhere: prior authorization, narrow networks, and other utilization gatekeepers shape access for most members.
Why it matters: The rebate surge makes clear how CMS’s payment model now leans toward Medicare Advantage, enabling the sale of “zero‑premium” plans that downplay the growing burden of out‑of‑pocket costs. The widening gap between cheap entry pricing and hefty spending limits tells its own story, plans are deliberately trading initial affordability for tighter control later in the care journey. Prior authorization in particular acts as both a budget valve and a patient obstacle. Policy debate will intensify in 2026 as regulators weigh how far to push on utilization limits or rethink the risk‑adjustment mechanics underpinning those large rebates. Nobody really knows whether reform momentum will stick, but scrutiny is clearly back.
For insurers, that extra rebate cushion keeps profits comfortable yet makes them more exposed if the policy tide turns. If MedPAC or CMS trims benchmarks or ring‑fences rebate uses, margins will compress fast. PBMs and specialty networks see a different signal: plans are leaning harder on utilization controls to offset growing demand. Employer benefit teams should watch closely, group and retiree MA plans tend to follow the same financial logic as the individual market. And honestly, you can feel the tension here: the numbers look strong, but the policy mood doesn’t. For more background on drug‑cost trends within MA formularies, visit RxPBM.ai.
