What happened
KFF Health News published a brief on Oct. 13, 2026, examining Medigap enrollment and premiums using National Association of Insurance Commissioners data compiled by Mark Farrah Associates through the end of 2025 and CMS Medicare Current Beneficiary Survey 2024 Survey File data.
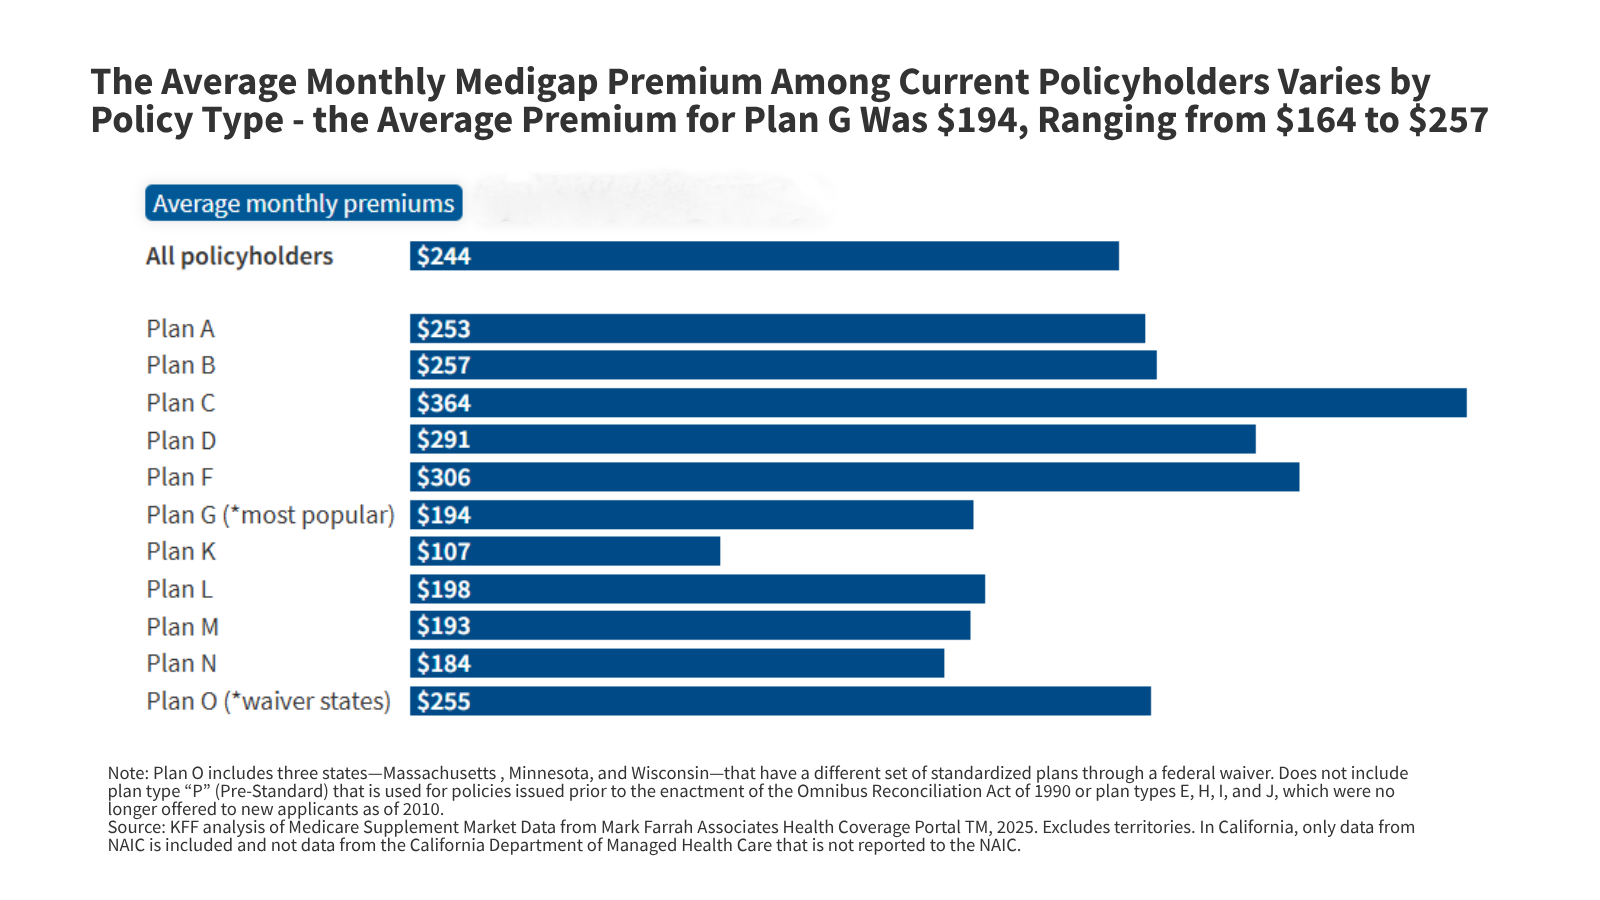
The brief says Medicare covers more than 70 million people, with 28.2 million enrolled in traditional Medicare. In 2024, 12.9 million people, or 46% of traditional Medicare beneficiaries, had a Medigap policy. Enrollment varied sharply by state, from 14% in Hawaii to 75% in Iowa. A wide state-level spread. Plan G was the most popular standardized Medigap policy type in 2025, representing 46% of all policyholders, or 6.3 million people, while Plan F represented 30%, or 4.2 million people, and has not been available to newly eligible beneficiaries since 2020. The average monthly premium among current Medigap policyholders was $244 in 2025, or $2,926 annually. For Plan G, the average monthly premium was $194, ranging from $164 in New Mexico to $257 in New York.
Why it matters
The clearest read is that Medigap remains a major affordability backstop inside traditional Medicare, but not a universal one. Not a universal one. KFF’s figures show that more than half of traditional Medicare beneficiaries did not have a Medigap policy in 2024, even though traditional Medicare provides no cap on out-of-pocket spending.
That gap matters commercially and politically because supplemental coverage is not landing evenly across the market. The brief says beneficiaries with Medigap are more likely to be White, have higher incomes, report better health, and be age 65 or older. It also highlights a sharp access split for people under 65 with disabilities, where just 8% had a Medigap policy versus 50% of beneficiaries ages 65 and older, which KFF says is due in part to the lack of federal guaranteed issue protections for those under 65.
For payers and investors, the likely implication is that Medigap remains a durable but unevenly penetrated segment, with pricing power and enrollment potential varying materially by geography and product mix. Plan G’s 46% share suggests the market has consolidated around the most comprehensive option available to newly eligible beneficiaries, while Plan F’s 30% share shows the legacy block is still large even after it was closed to newly eligible beneficiaries in 2020.
Expect continued scrutiny on premium affordability and state-level access rules, especially where take-up is low and premium variation is wide. For broader benefit design context, see PharmaBenefits.ai. For related drug pricing and coverage issues, see RxInfo.ai.